A significant chunk of Datadog’s costs includes the massive overall cloud bills. Unfortunately, despite using internal cost management tools, Datadog fails to break down and cushion these costs.
However, to implement Datadog strategies, one must thoroughly know how Datadog works. And one of the easiest ways to do this is to certify yourself with the Datadog Fundamentals course.
This course not only helps you learn the Datadog features but also allows you to master skills for visualizing system metrics in Datadog, explore advanced log aggregation techniques, and set of monitors and notifications, ensuring timely alerts for any server or application performance deviations.
This blog will discuss 7 pro tips for managing and reducing Datadog costs. But before, let’s briefly overview Datadog and pricing models.
It’s time to dive in.
What is Datadog?
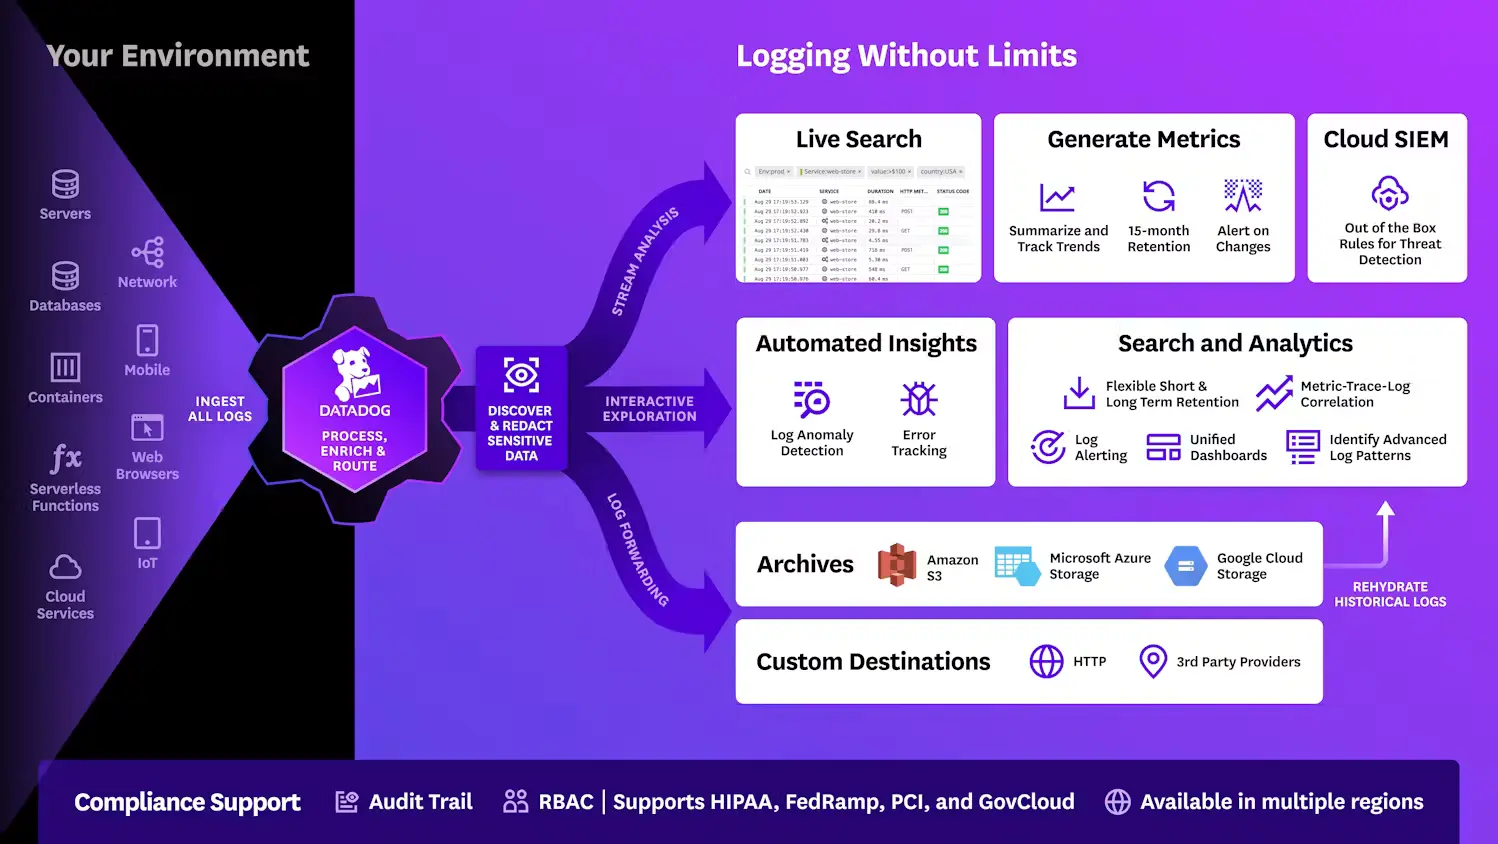
Datadog is a cloud monitoring and analytics tool that helps organizations ensure their applications run smoothly, regardless of their hosting environment — on-premises, hybrid, or across multiple cloud providers.
With its comprehensive toolkit, Datadog provides real-time performance tracking, alerting, and analytics, allowing teams to identify and resolve issues quickly. Its extensive integration capabilities make it ideal for overseeing complex infrastructures, ensuring optimal application performance and improved cost efficiency.
At its core, Datadog offers real-time monitoring of servers, databases, tools, and services via a SaaS-based data analytics platform. This empowers teams to track system performance, understand user behaviors, and troubleshoot issues quickly. Datadog’s unmatched integration capabilities and user-friendly interface distinguish it from alternatives like Sematext, Splunk, and New Relic.
Datadog cost optimization to the rescue
To improve the cost of using Datadog, you must identify inefficiencies that can be removed, minimized, or repurposed for savings. Cost optimization for Datadog, like other cloud tools, requires a clear understanding of where your money is going. Only then can you efficiently determine what to cut or retain without compromising your monitoring and observability capabilities.
Organizations experiment with various workarounds to optimize Datadog costs, including:
- Reducing the time logs are kept in Datadog
- Ingesting a portion of logs without retaining them, dealing with log rehydration when necessary
- Ingesting fewer logs altogether potentially hinders observability and monitoring
However, these workarounds are not ideal. They can hinder insights and negatively impact regulatory compliance. Instead, here are five legitimate ways to reduce your Datadog costs without sacrificing your ability to derive actionable insights.
7 Pro Tips for Managing and Reducing Datadog Costs
Here are seven pro tips to manage and reduce your Datadog costs.
1. Turning off log management
One of Datadog’s more resource-intensive features is log management, which allows you to view ingested logs in real-time across all your environments. If you’re not using this feature extensively, consider turning it off. To do this, go to your Datadog dashboard, navigate to the ‘Logs’ section, and review your log management settings. Disabling unnecessary log collection can significantly reduce costs, especially for businesses not reliant on real-time log data.
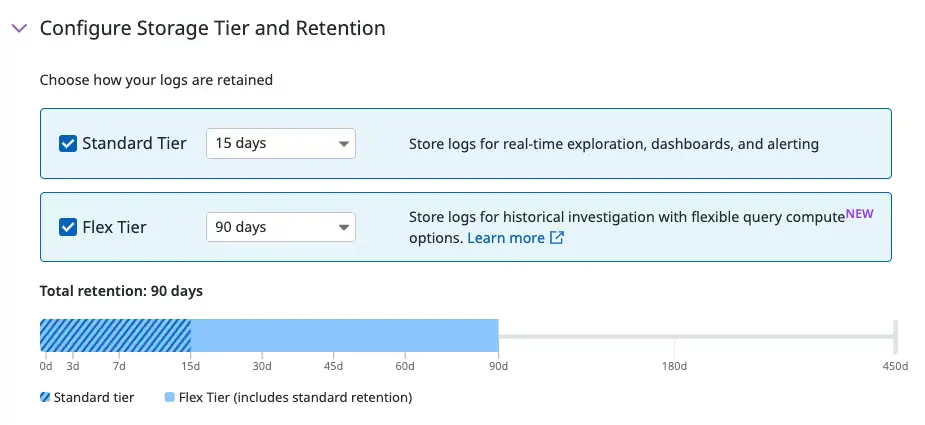
Alternatively, you can limit your logging by assessing which logs you must collect and for how long. Datadog’s Flex Logs feature enables you to flexibly choose your querying capacity, retention period, and the number of places your logs need storage. This way, you can effectively optimize your log management settings to balance cost and necessity.
2. Turning on spike alerts
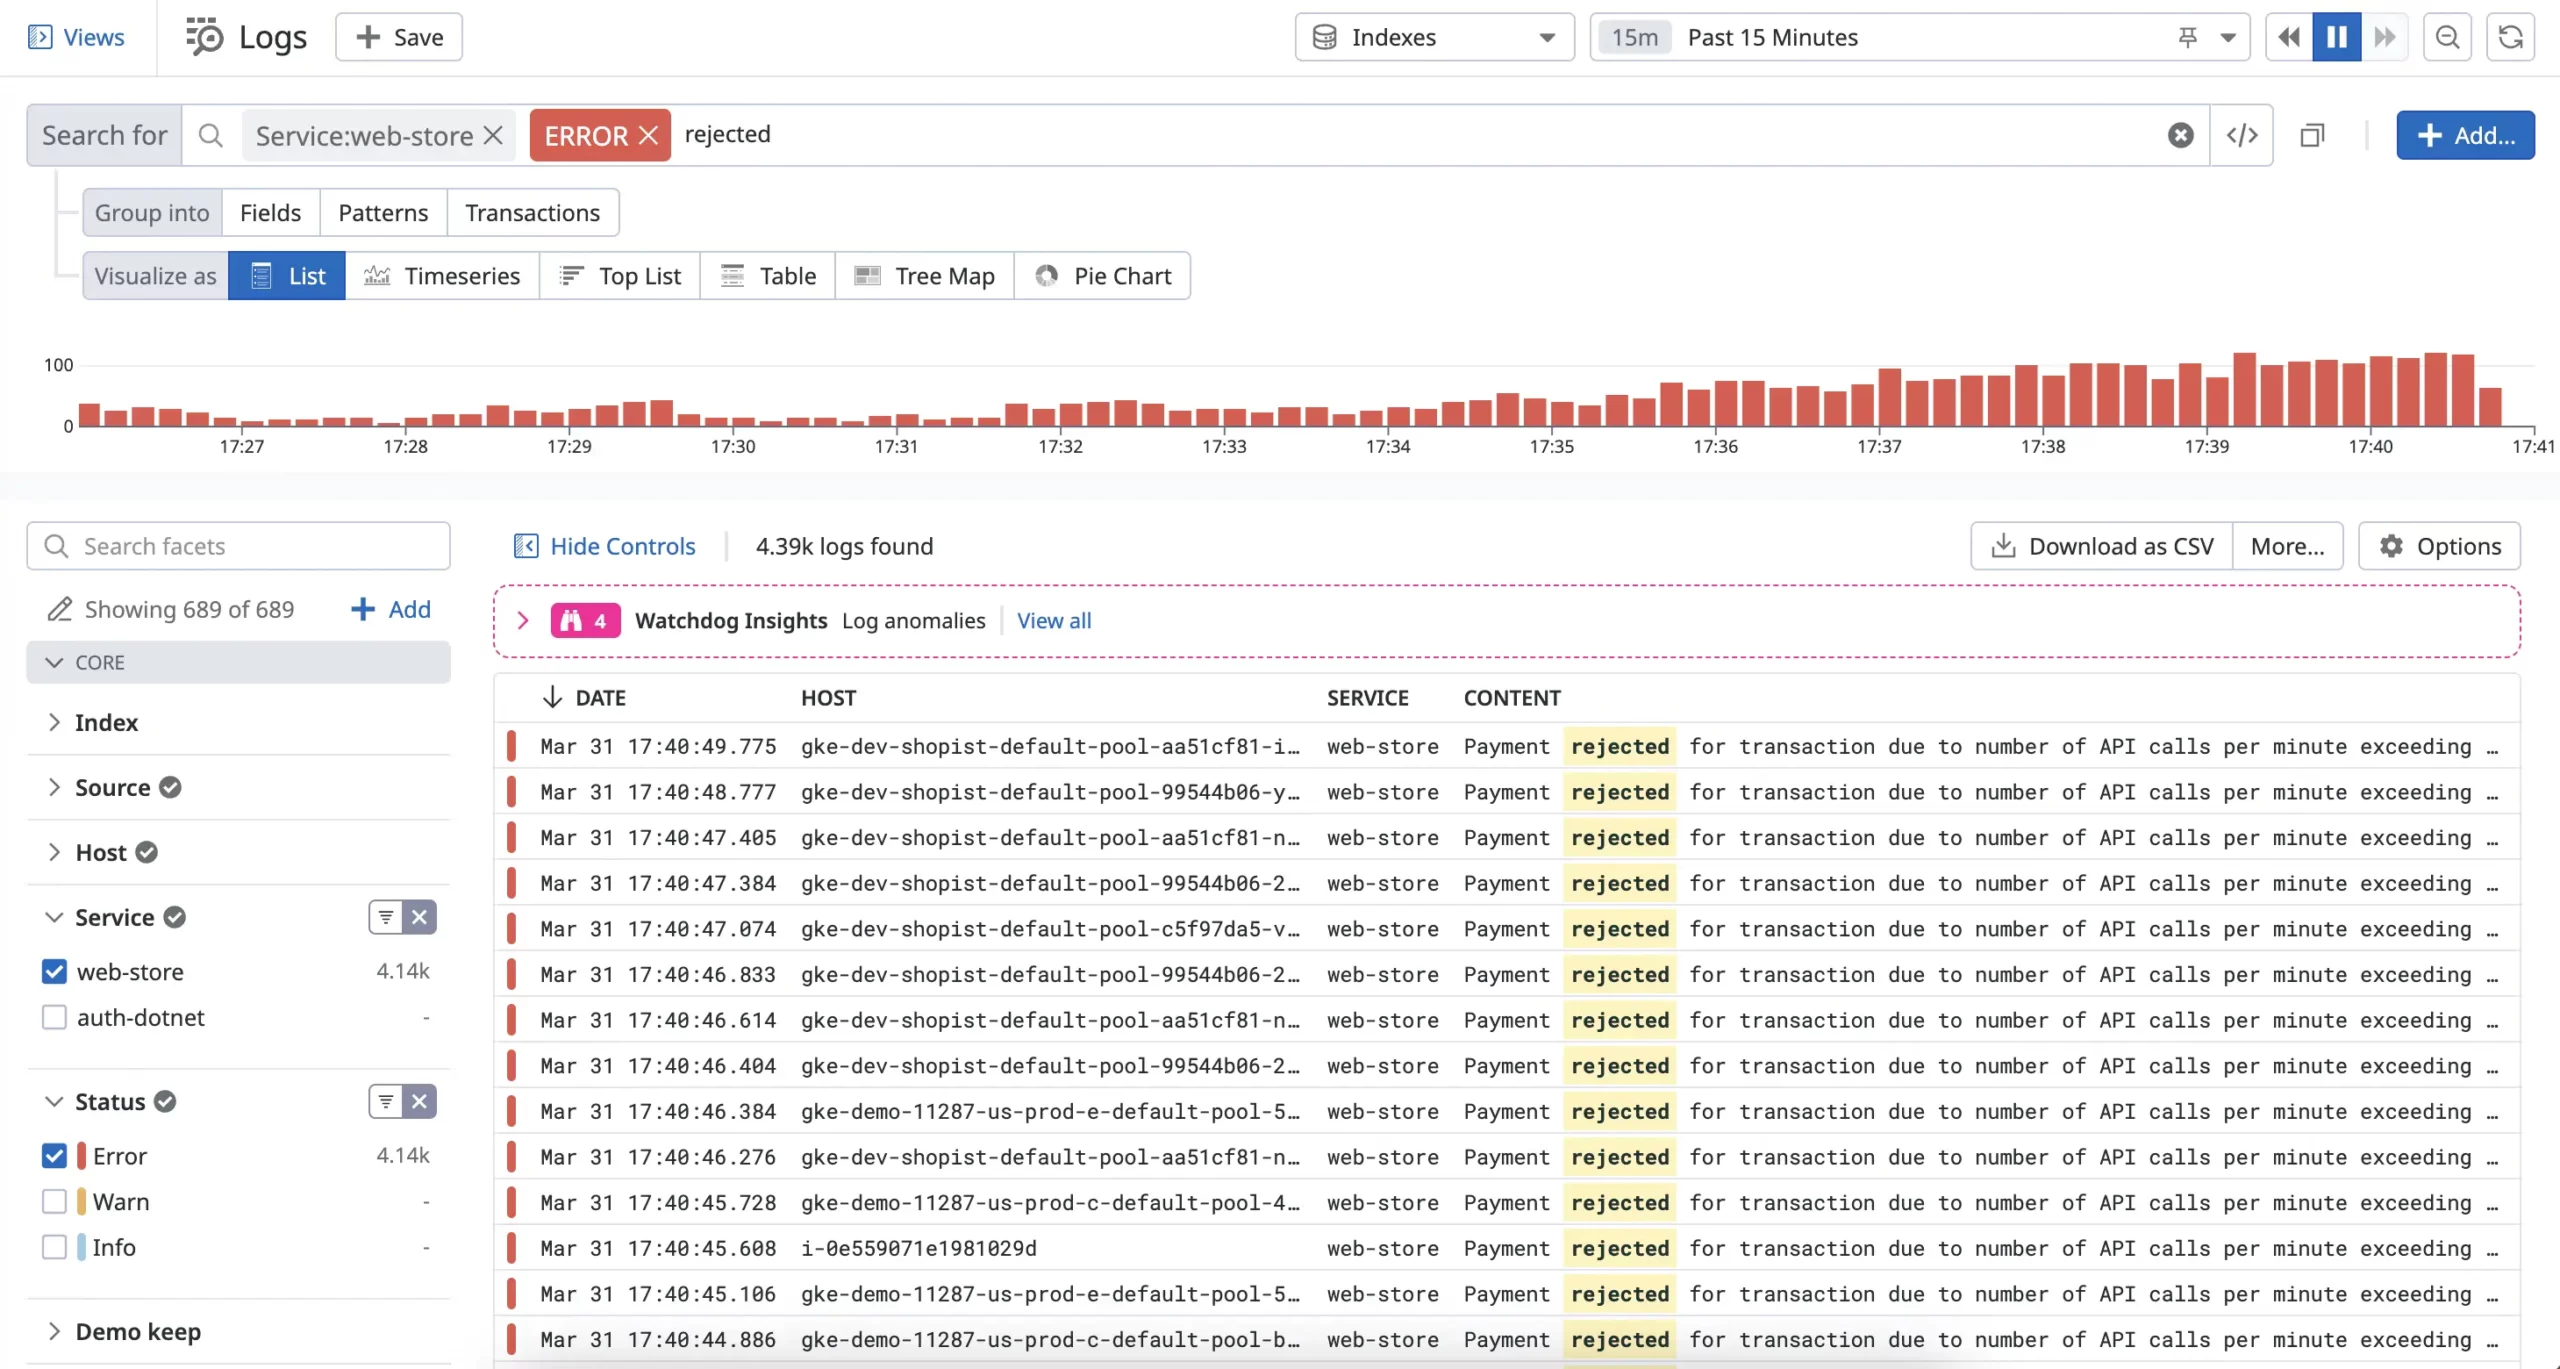
You can set up spike alerts in Datadog to keep tabs on unexpected cost surges. These alerts notify you when there’s a sudden increase in usage or cost, allowing you to address issues before they inflate your Datadog bill.
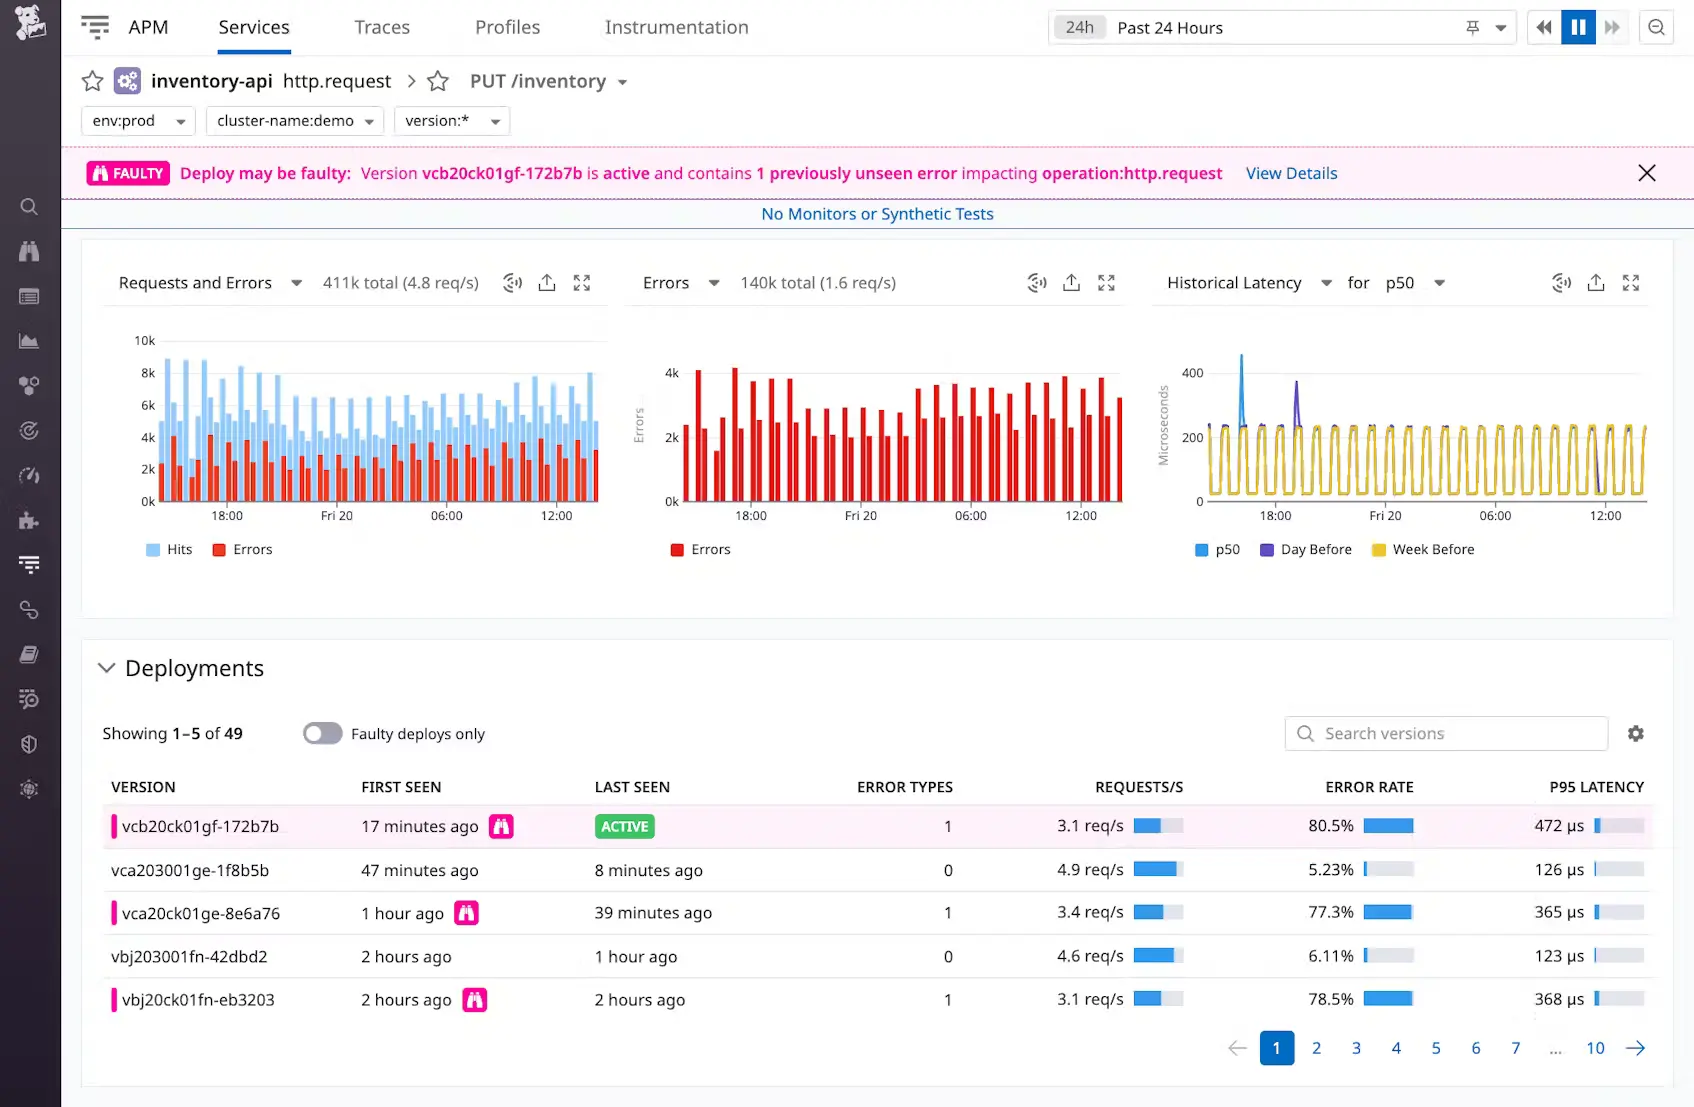
Datadog’s Watchdog feature detects anomalies in near real-time across your ingested logs. It identifies significant increases in the number of logs with a warning, error, or above status level relative to historical baselines. Watchdog analyzes your data to understand when log behavior changes substantially enough to cause concern.
To set up these alerts, follow these steps:
- Go to the ‘Monitors’ Section:
- Log in to your Datadog dashboard.
- Navigate to the ‘Monitors’ section.
- Create a New Monitor:
- Click on the ‘New Monitor’ button.
- Select the type of monitor you want to create (e.g., ‘Log Monitor’).
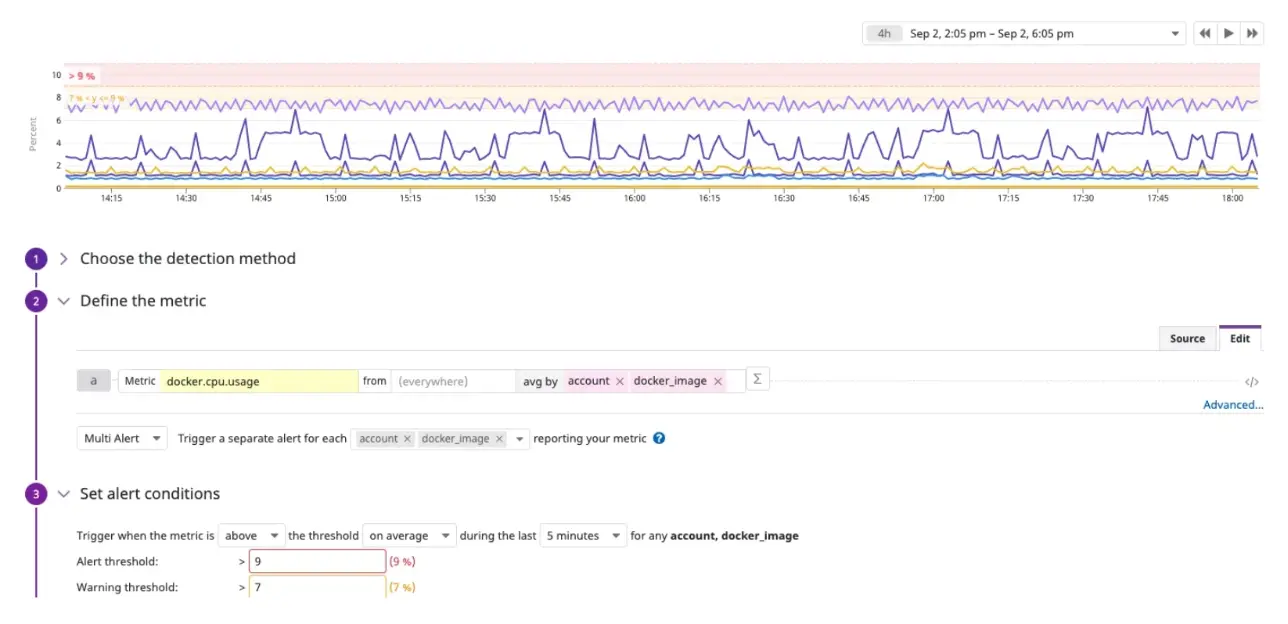
- Configure the Alert Conditions:
- Define the conditions for the alert, such as the threshold for the number of logs with a warning or error status.
- Set the alert frequency and notification preferences.
- Set Up Watchdog:
- Enable Watchdog to monitor your logs for anomalies.
- Configure it to detect significant changes in log behavior and notify you when concerns arise.
- Save and Test the Monitor:
- Save your new monitor.
- Test the monitor to ensure it triggers alerts appropriately based on your defined conditions.
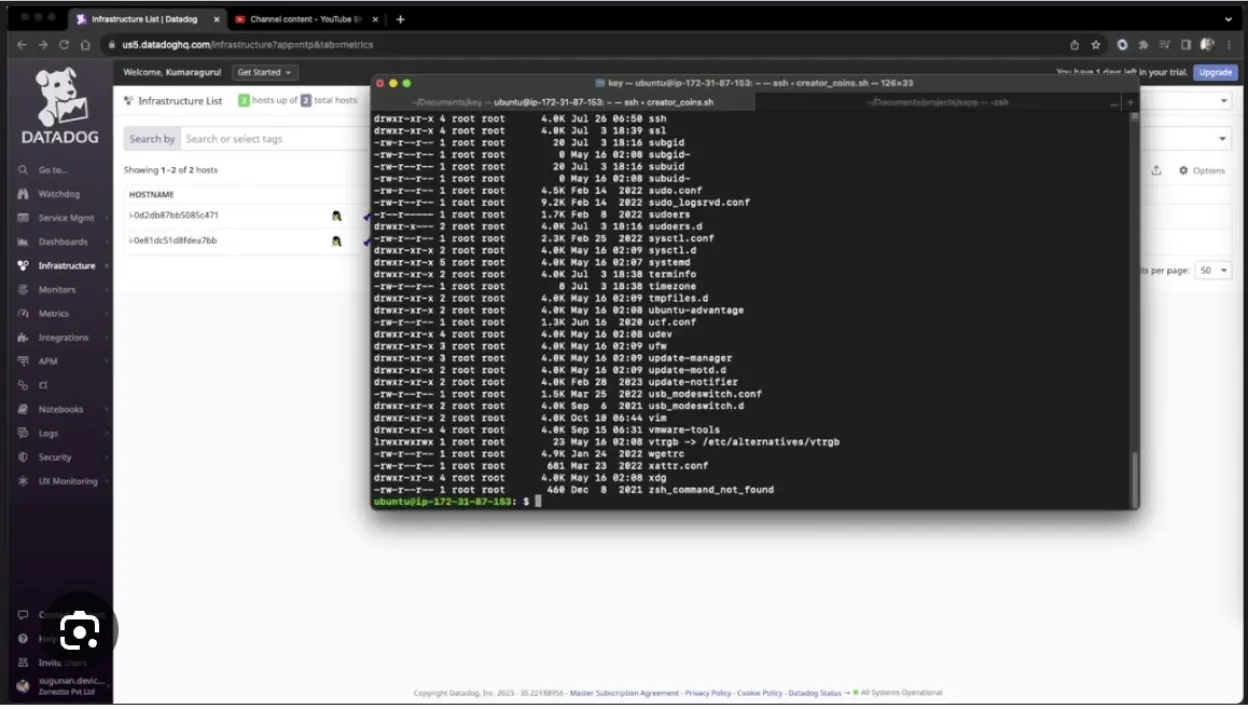
3. Uninstalling Datadog Agent
The Datadog Agent is a crucial component for monitoring your infrastructure, but it can also add to your costs when installed on inactive or underused servers. To optimize your Datadog expenses, it’s essential to remove agents from servers or instances that are no longer needed.
Steps to Optimize by Uninstalling Datadog Agents:
- Audit Your Infrastructure:
- Conduct a thorough audit to identify servers or instances where the Datadog Agent is no longer necessary. This includes servers for short-term projects, inactive test environments, or decommissioned systems.
- Identify any redundant or underutilized instances and remove the Datadog Agent from them.
- Uninstalling the Datadog Agent:
- For Windows Servers:
- Open the ‘Add or Remove Programs’ feature in the Control Panel.
- Find the Datadog Agent in the list of installed programs.
- Click ‘Uninstall’ to remove the agent.
- For Linux Servers:
- Use the package manager that was used to install the agent. For example, if you used apt, the command would be:
- For macOS:
- Run the uninstall command provided in Datadog’s documentation. Typically, this command can be found in the agent’s installation directory. An example command might be:
- For Windows Servers:
By following these steps, you can ensure that Datadog Agents are only running on necessary servers, helping to optimize your monitoring costs effectively.
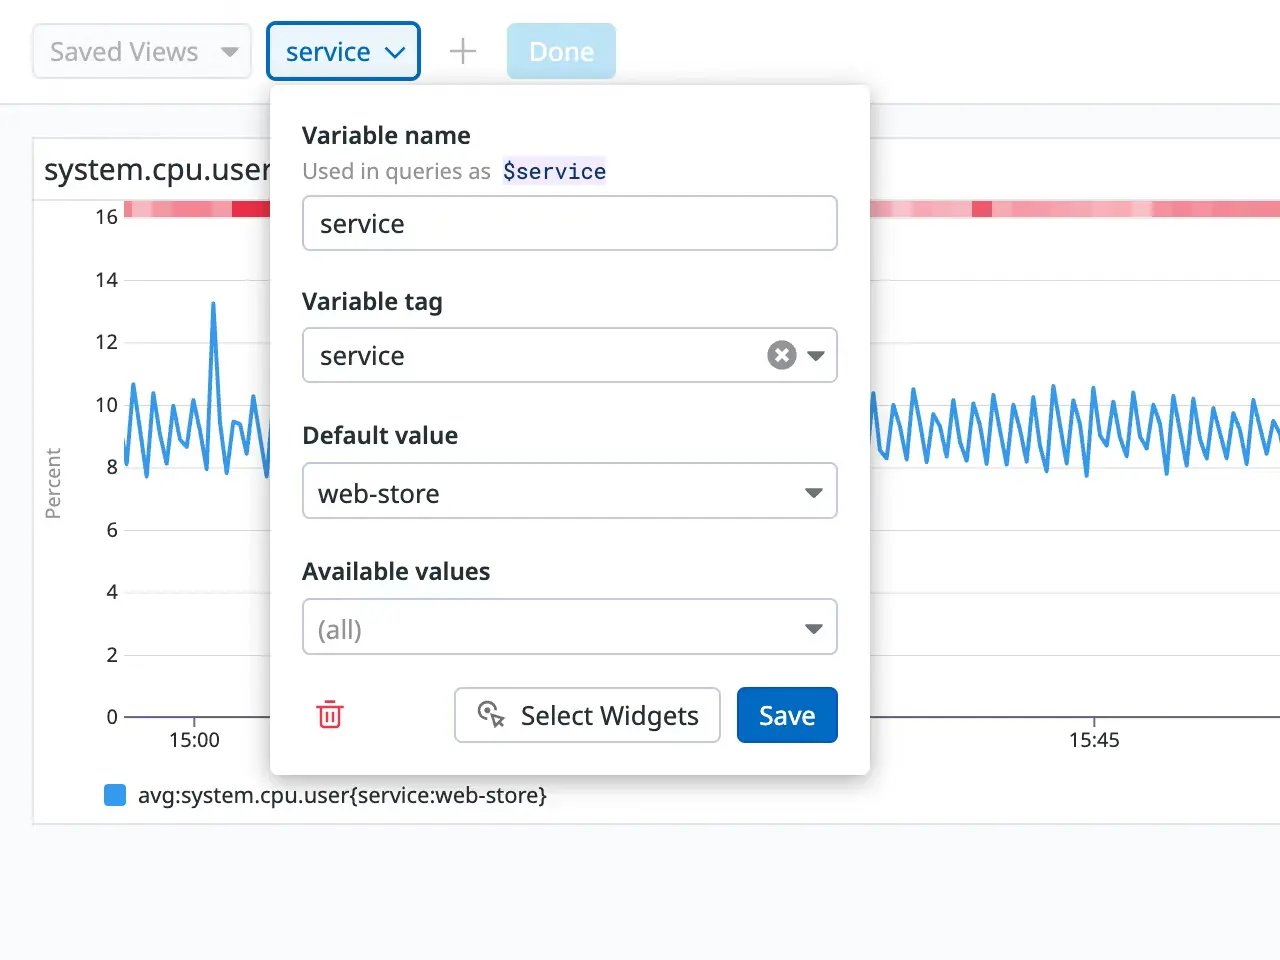
4. Reducing unused tags
Tags in Datadog are not just a tool for sorting and visualizing data; they are a powerful resource for optimizing data management and reducing costs. By following these steps, you can harness the full potential of your tagging strategy.
- Audit Your Tags:
- Review all the tags currently in use.
- Identify and eliminate non-essential tags to reduce data processing overhead.
- Implement Tag Policies:
- Use tag policies to ensure that only authorized tags are used.
- Datadog allows you to set up the following rules for tag policies:
- Require Tags Only: Ensure all metrics and logs have specific required tags.
- Require Tags with Mandatory Values: Ensure certain tags have specific mandatory values.
- Optional Tags with Mandatory Values: Allow optional tags, but if used, they must have particular values.
- Review and Adjust Your Tagging Strategy:
- Ensure that only relevant tags are applied to your metrics and logs.
- Consolidate similar tags to reduce the overall number of tags in use.
- Implement Tag Policies in Datadog:
- Go to the Datadog dashboard.
- Navigate to the ‘Monitors’ section.
- Set up policies according to your requirements to block monitors with unauthorized tags from being created.
 5. Leveraging committed use discounts
 5. Leveraging committed use discounts
Datadog has monthly minimum usage commitments for infrastructure, APM, log management, and database monitoring. While not all rates are publicly shared, container monitoring provides a clear example of potential savings: prepaid containers cost $1 monthly. In contrast, on-demand containers cost $0.002 per container per hour.
Compared to on-demand pricing, prepaid containers save $0.44 per container in a 30-day month. For 1,000 containers, this translates to monthly savings of $440 and annual savings of $5,280. Committing to prepaid containers can significantly reduce costs as your application scales.
6. Reconsidering and monitoring custom metrics
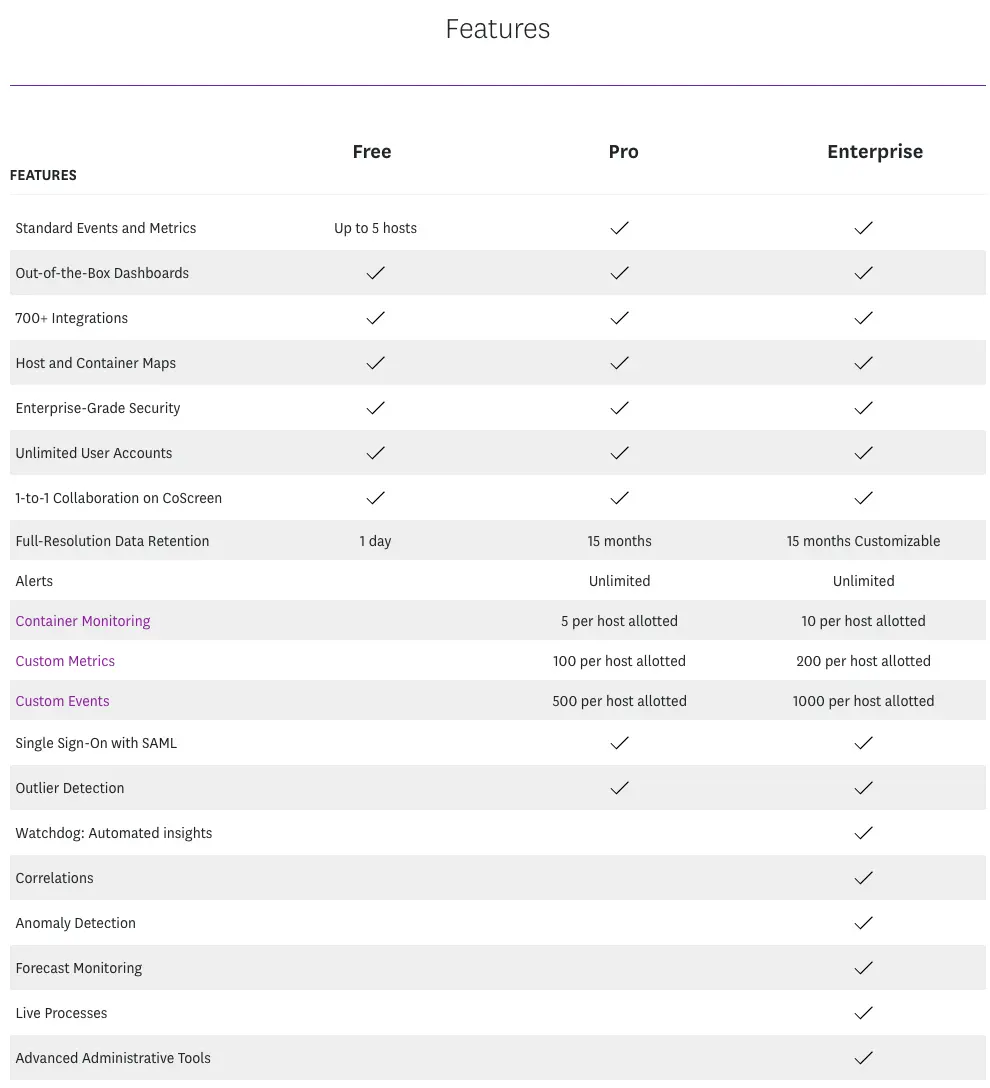
Datadog deems a metric custom if it doesn’t come from one of its 600+ integrations. Each custom metric is identifiable by name and tag values (such as host tags). The Pro plan offers 100 custom metrics per host, while the Enterprise plan offers 200.
Metrics are pooled across hosts. For example, 1,000 custom metrics are allotted for every ten hosts monitored. By configuring only some hosts for custom metrics, you can assign 400 custom metrics to two hosts and 200 to the remaining eight (such as build servers).
7. Using ingestion controls and retention filters
Datadog allows you to set ingestion controls to send only essential traces from your applications. Additionally, you can use retention filters to specify how long each indexed span is retained as soon as traces arrive. Adjusting these settings effectively can help reduce overages on APM costs.
Features of Datadog
Datadog offers a variety of features, including:
- Monitoring: Datadog can monitor servers, databases, tools, and services across multiple cloud providers. It collects metrics, logs, and traces from these systems, displaying them in a unified dashboard.
- Alerting: Datadog sends alerts when metrics or logs exceed predefined thresholds. Alerts can be sent via email, Slack, or PagerDuty.
- Dashboards: Datadog allows the creation of custom dashboards to display metrics, logs, and traces, which can be shared with other users.
- Reporting: Datadog generates reports on metrics, logs, and traces, helping track performance over time.
- Security: Datadog monitors for security threats, such as unauthorized access or data breaches.
Understanding Datadog Pricing Strategy
Datadog pricing is usage-based and varies depending on the specific monitoring services you use. Monitoring infrastructure costs differ from tracking application performance metrics, among other services. Several variables influence pricing, including charges per host, user, GB of data, by spending, or per session/test/function/run.
The free tier provides core monitoring capabilities with limited data retention. More advanced plans include full-scale Application Performance Monitoring (APM), log management, and anomaly detection features. The pricing structure is primarily based on the volume of data monitored and the number of users. This allows businesses to select a plan that fits their size and requirements, with the flexibility to scale as they grow.
For instance, Datadog charges per host per month for infrastructure monitoring. A host is defined as any virtual or physical OS instance being monitored, such as a server, virtual machine (VM), Kubernetes node, or Azure App Service Plan instance. The service is free for up to five hosts with 1-day full-resolution data retention. Beyond that, Datadog plans start at $15 per monthly host, with volume discounts available for usage exceeding 600 hosts.
Why is Datadog so expensive?
Monitoring costs can add up quickly with Datadog. For instance, the service can pull substantial logs in microservices environments, increasing ingestion costs. Additionally, Datadog charges higher data retention fees the longer you store monitoring metrics and logs.
Datadog also charges $1 per container per month (for committed use), meaning costs can escalate significantly as your containerized application scales.
Building your cloud monitoring stack with open-source tools like Grafana and Prometheus can be time-consuming, require substantial skill, and may be more expensive than using a SaaS service like Datadog.
However, like most engineers, CTOs, and CFOs, you are likely under pressure to keep costs low and ROI high. Instead of indiscriminately slashing your Datadog cloud monitoring costs, it is more effective to optimize them.
Summary
I hope this blog helps you understand Datadog costs and how you can implement cost optimization to save your precious dollars and utilize them where needed. These are just a few strategies. Various other ways, like contacting your account manager, reducing egress charges, choosing the right commitment level, etc., will help reduce Datadog costs.
Check out our Whizlabs resources, such as practice papers, detailed video lectures by industrial experts, and hands-on labs to learn more about the Datadog certification and gain holistic skills to deal with Datadog in the real world.
- 7 Pro Tips for Managing and Reducing Datadog Costs - June 24, 2024
- What is Azure Data Factory? - June 5, 2024
- An Introduction to Databricks Apache Spark - May 24, 2024
- What is Microsoft Fabric? - May 16, 2024
- Which Kubernetes Certification is Right for You? - April 10, 2024
- Top 5 Topics to Prepare for the CKA Certification Exam - April 8, 2024
- 7 Databricks Certifications: Which One Should I Choose? - April 8, 2024
- What are the benefits of having a Google Cloud Database Engineer Certification? - March 18, 2024